📉 Median Sales Price Disparity in 2024 📉
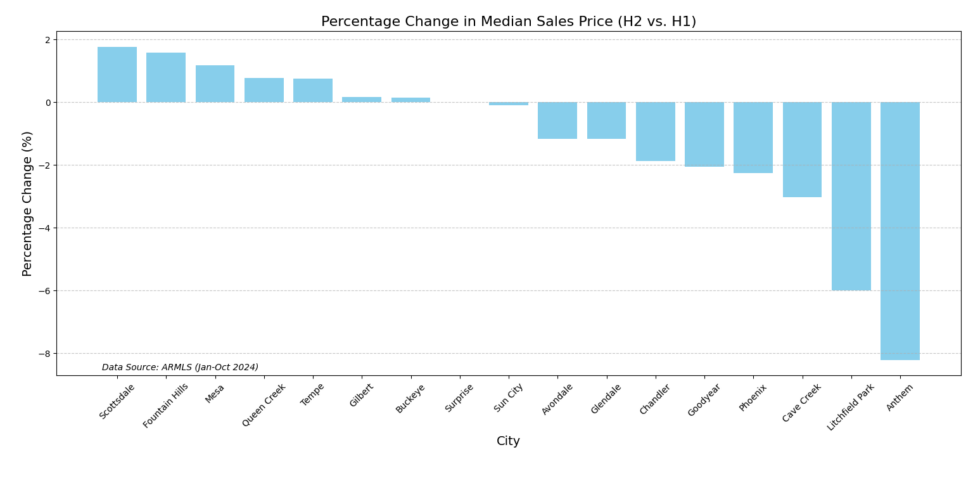
This graph highlights the disparity in median sales prices across select cities in Maricopa County, comparing the first half (H1) of 2024 to the second half (H2). While H2 traditionally benefits from summer sales momentum, this year tells a different story.
Key Takeaways:
Resilience in Some Areas: Cities like Scottsdale and Fountain Hills saw modest price increases from H1 to H2, suggesting localized demand or unique market conditions.
Widespread Declines: Most cities, including Anthem, Phoenix, and Chandler, experienced a dip in median sales prices.
Market Stress: Declining affordability and cautious buyers are likely contributors to these price shifts, despite two rate reductions from the Fed this year.
Why It Matters:
This data emphasizes the ongoing stress in the real estate market. Understanding these disparities helps professionals make informed decisions, whether it’s advising sellers to adjust pricing strategies or targeting buyers in cities where affordability has improved.
📊 Graph Overview: The graph demonstrates the percentage change in median sales prices, visually showcasing which cities have been hit hardest by this disparity.
📞 Call or Message Me Today
I am your One-Stop for Real Estate and Mortgages.
🌐 Visit My Website: https://lnkd.in/gW78baJG
👉 Schedule an Online Consultation:
https://lnkd.in/gW78baJG
🏠 What’s Your Home Worth?
Download an Instant Estimate at ArizonaHouseValues.net
🔎 Search Phoenix Listings:
https://lnkd.in/geRfT5Wi
hashtagRealEstate hashtagPhoenixMarket hashtagMortgageSolutions hashtagMaricopaCounty hashtagDataDrivenDecisions hashtagMarketTrends hashtagHomebuying hashtagSellingStrategies


Leave a Reply